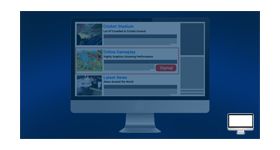
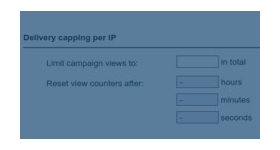
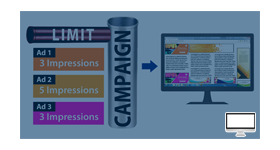
Do you want an advanced analytical report for Revive? Tracking and Reporting plugin for Delivery Limitation used to achieve all possible analytical report for revive delivery options.
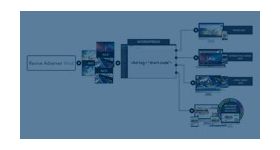
Do you want an advanced analytical report for Revive based on on delivery limitations? This plugin used to achieve all possible analytical report for revive delivery options. Revive had delivery options with following breakdowns such as client, site, geo and time delivery options.
Analytical - Tracking
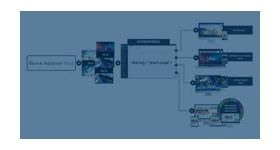
Analytical module used to track following user information’s
User Geo information such as country code, region, city, postal code, latitude, longitude,ISP, DMA and area code.
User client information such as user agent, browser, operating system,domain,ip address and languages
User site information such as page url , referring page, source value and variable
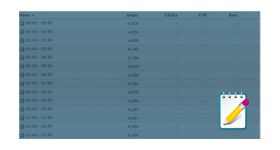
Time information such as day of week
Analytical - Reporting
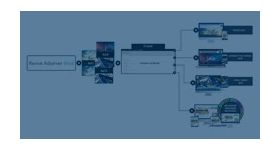
Analytical module used to report following user information’s
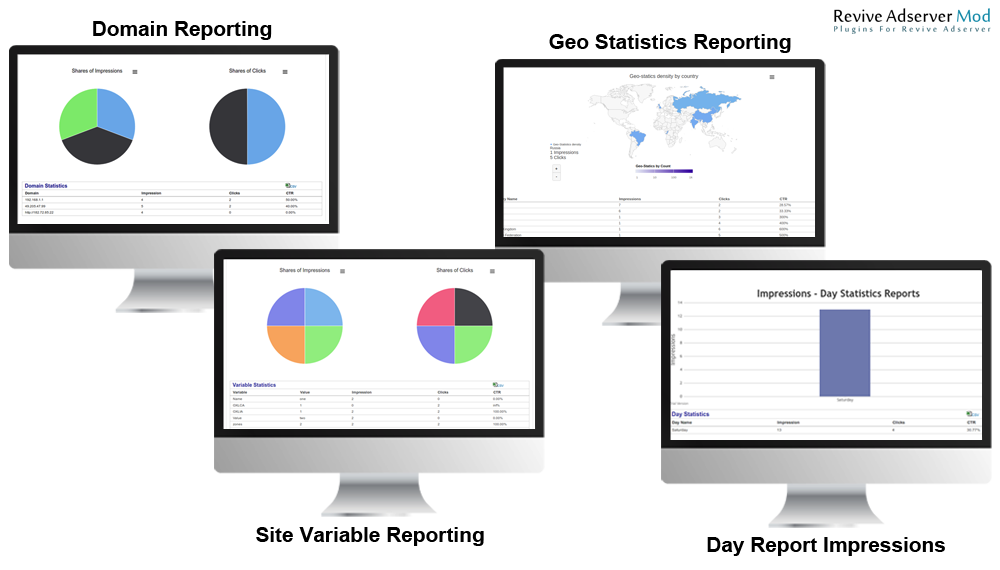
User geo information such as country code, region, city, postal code, latitude, longitude,ISP, DMA and area code in Google map.
User client information such as user agent, browser, operating system, domain, ip address and languages in pie chart.
User site information such as page url and referring page in line chart and source value and variable in pie chart.
Time information such as day of week in bar chart.
Export to CSV
All reporting can export as csv.
Frequently Asked Questions
What does the Tracking and Reporting for Delivery Limitation plugin provide?
+
The plugin provides advanced analytics and reporting for Revive Adserver delivery limitation features such as frequency capping, day parting, and campaign pacing. It includes detailed reports and graphical charts that help visualize the impact of delivery restrictions on campaign performance.
Why is delivery limitation reporting important for campaign management?
+
Standard reporting shows overall impressions and clicks but does not reveal how delivery limitations affect campaign execution. This plugin helps campaign managers identify whether frequency caps, scheduling rules, or pacing settings are causing under-delivery or limiting campaign reach.
What types of graphical charts does the plugin generate?
+
The plugin generates interactive graphical charts that visualize delivery performance across various limitation settings. Users can analyze trends over time, filter report data, and export chart information for client reporting and further analysis.
Is this plugin suitable for ad networks managing multiple advertiser campaigns simultaneously?
+
Yes. The plugin is ideal for ad networks and agencies managing multiple campaigns with different delivery constraints. It provides a centralized view of how delivery limitations affect campaign performance, making optimization and advertiser reporting more efficient.
Does the plugin modify delivery limitation settings or is it purely a reporting tool?
+
The plugin is purely a reporting and analytics solution. It does not alter campaign delivery settings, frequency caps, scheduling rules, or pacing configurations. All delivery limitation changes continue to be managed through the standard Revive Adserver campaign settings.