


Graph Report for Statistics
$30.00
In stock
SKU
2527
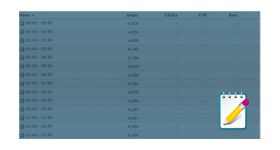
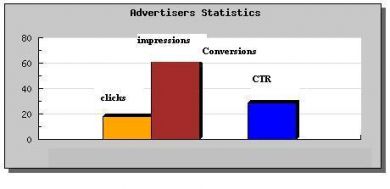
The graph report for statistics plugin for revive ad server is used to generate graphical report for the ad banners and the revenue gained by it.
The graph report for statistics plugin for revive ad server is used to generate graphical report for the ad banners and the revenue gained by it. By using this plugin, the user can differentiate the high and low conversion banners and mostly visited publisher sites of the user.
The report is generated for the following options,
- Report for last month
- Report for this month
- Report for last seven days
- Report for this week
- Report for today
- Report for yesterday
- Report for specific dates
- All statistical report
The graph provides all needed information about the banners and the publisher website, with the help of this report, the user can able to find the best banner and site in the ad network.
Benefits of this plugin
- The plugin supports all version of revive and openx ad server.
- The user can compare the records and generate graphical data for the specific date, week or month.
Frequently Asked Questions
Write Your Own Review
Related Products